


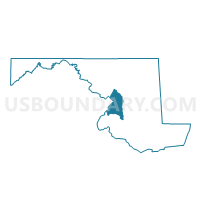
District 12, Oxon Hill, Prince George's County, Maryland
About
Outline

Summary
| Unique Area Identifier | 133735 |
| Name | District 12, Oxon Hill |
| County | Prince George's County |
| State | Maryland |
| Area (square miles) | 22.78 |
| Land Area (square miles) | 19.21 |
| Water Area (square miles) | 3.57 |
| % of Land Area | 84.34 |
| % of Water Area | 15.66 |
| Latitude of the Internal Point | 38.79239610 |
| Longtitude of the Internal Point | -76.98978940 |
| Total Population | 67,832 |
| Total Housing Units | 28,567 |
| Total Households | 26,150 |
| Median Age | 36.8 |
Maps

Graphs
Select a template below for downloading or customizing gragh for District 12, Oxon Hill, Prince George's County, Maryland


Neighbors
Neighoring County Subdivision (by Name) Neighboring County Subdivision on the Map
- District 5, Piscataway, Prince George's County, MD
- District 6, Spauldings, Prince George's County, MD
- District 9, Surratts, Prince George's County, MD
- Alexandria city, Alexandria city, VA
- Mount Vernon district, Fairfax County, VA
- Washington city, District of Columbia, DC
Top 10 Neighboring Place (by Population) Neighboring Place on the Map
- Washington city, DC (601,723)
- Alexandria city, VA (139,966)
- Fort Washington CDP, MD (23,717)
- Camp Springs CDP, MD (19,096)
- Oxon Hill CDP, MD (17,722)
- Glassmanor CDP, MD (17,295)
- Hillcrest Heights CDP, MD (16,469)
- Fort Hunt CDP, VA (16,045)
- Friendly CDP, MD (9,250)
- Temple Hills CDP, MD (7,852)
Top 10 Neighboring Unified School District (by Population) Neighboring Unified School District on the Map
- Fairfax County Public Schools, VA (1,081,726)
- Prince George's County Public Schools, MD (863,420)
- District of Columbia Public Schools, DC (601,723)
- Alexandria City Public Schools, VA (139,966)
Top 10 Neighboring State Legislative District Lower Chamber (by Population) Neighboring State Legislative District Lower Chamber on the Map
- State Legislative District 26, MD (110,580)
- State Legislative District 25, MD (110,022)
- State Legislative District 24, MD (107,460)
- State House District 44, VA (79,883)
- State House District 45, VA (78,709)
- State House Districts not defined (Prince George's County), MD (0)
Top 10 Neighboring State Legislative District Upper Chamber (by Population) Neighboring State Legislative District Upper Chamber on the Map
- State Senate District 36, VA (219,048)
- State Senate District 30, VA (194,547)
- State Senate District 26, MD (110,580)
- State Senate District 25, MD (110,022)
- State Senate District 24, MD (107,460)
- Ward 8, DC (70,712)
- State Senate Districts not defined (Prince George's County), MD (0)
Top 10 Neighboring 111th Congressional District (by Population) Neighboring 111th Congressional District on the Map
- Congressional District 5, MD (767,369)
- Congressional District 4, MD (714,316)
- Congressional District 8, VA (701,010)
- Delegate District (at Large), DC (601,723)
Top 10 Neighboring Census Tract (by Population) Neighboring Census Tract on the Map
- Census Tract 8014.07, Prince George's County, MD (6,308)
- Census Tract 8017.07, Prince George's County, MD (6,175)
- Census Tract 8013.05, Prince George's County, MD (5,569)
- Census Tract 8017.04, Prince George's County, MD (5,467)
- Census Tract 8019.01, Prince George's County, MD (4,909)
- Census Tract 8014.04, Prince George's County, MD (4,812)
- Census Tract 8018.07, Prince George's County, MD (4,685)
- Census Tract 98.11, District of Columbia, DC (4,365)
- Census Tract 8014.05, Prince George's County, MD (4,245)
- Census Tract 8017.01, Prince George's County, MD (4,195)
Top 10 Neighboring 5-Digit ZIP Code Tabulation Area (by Population) Neighboring 5-Digit ZIP Code Tabulation Area on the Map
- 20744, MD (50,722)
- 20020, DC (49,864)
- 20748, MD (38,792)
- 20032, DC (35,653)
- 22314, VA (29,653)
- 20745, MD (28,451)
- 22308, VA (12,737)
- 22307, VA (9,581)
Data
Demographic, Population, Households, and Housing Units
** Data sources from census 2010 **
Show Data on Map
Download Full List as CSV
Download Quick Sheet as CSV
| Subject | This Area | Prince George's County | Maryland | National |
|---|---|---|---|---|
| POPULATION | ||||
| Total Population Map | 67,832 | 863,420 | 5,773,552 | 308,745,538 |
| POPULATION, HISPANIC OR LATINO ORIGIN | ||||
| Not Hispanic or Latino Map | 62,336 | 734,448 | 5,302,920 | 258,267,944 |
| Hispanic or Latino Map | 5,496 | 128,972 | 470,632 | 50,477,594 |
| POPULATION, RACE | ||||
| White alone Map | 4,904 | 166,059 | 3,359,284 | 223,553,265 |
| Black or African American alone Map | 54,887 | 556,620 | 1,700,298 | 38,929,319 |
| American Indian and Alaska Native alone Map | 214 | 4,258 | 20,420 | 2,932,248 |
| Asian alone Map | 2,964 | 35,172 | 318,853 | 14,674,252 |
| Native Hawaiian and Other Pacific Islander alone Map | 37 | 541 | 3,157 | 540,013 |
| Some Other Race alone Map | 2,967 | 73,441 | 206,832 | 19,107,368 |
| Two or More Races Map | 1,859 | 27,329 | 164,708 | 9,009,073 |
| POPULATION, SEX | ||||
| Male Map | 31,328 | 414,161 | 2,791,762 | 151,781,326 |
| Female Map | 36,504 | 449,259 | 2,981,790 | 156,964,212 |
| POPULATION, AGE (18 YEARS) | ||||
| 18 years and over Map | 51,589 | 657,421 | 4,420,588 | 234,564,071 |
| Under 18 years | 16,243 | 205,999 | 1,352,964 | 74,181,467 |
| POPULATION, AGE | ||||
| Under 5 years | 4,326 | 58,564 | 364,488 | 20,201,362 |
| 5 to 9 years | 4,182 | 54,482 | 366,868 | 20,348,657 |
| 10 to 14 years | 4,579 | 55,923 | 379,029 | 20,677,194 |
| 15 to 17 years | 3,156 | 37,030 | 242,579 | 12,954,254 |
| 18 and 19 years | 1,918 | 30,409 | 163,662 | 9,086,089 |
| 20 years | 953 | 15,742 | 81,013 | 4,519,129 |
| 21 years | 875 | 14,904 | 77,465 | 4,354,294 |
| 22 to 24 years | 2,911 | 39,998 | 235,220 | 12,712,576 |
| 25 to 29 years | 4,858 | 64,682 | 393,548 | 21,101,849 |
| 30 to 34 years | 4,557 | 61,058 | 368,494 | 19,962,099 |
| 35 to 39 years | 4,709 | 60,695 | 377,409 | 20,179,642 |
| 40 to 44 years | 4,849 | 63,237 | 418,163 | 20,890,964 |
| 45 to 49 years | 5,152 | 66,200 | 461,585 | 22,708,591 |
| 50 to 54 years | 4,868 | 61,853 | 440,619 | 22,298,125 |
| 55 to 59 years | 4,627 | 53,261 | 377,989 | 19,664,805 |
| 60 and 61 years | 1,783 | 19,386 | 134,879 | 7,113,727 |
| 62 to 64 years | 2,419 | 24,483 | 182,900 | 9,704,197 |
| 65 and 66 years | 1,190 | 13,191 | 97,978 | 5,319,902 |
| 67 to 69 years | 1,581 | 16,570 | 128,618 | 7,115,361 |
| 70 to 74 years | 1,881 | 20,339 | 159,761 | 9,278,166 |
| 75 to 79 years | 1,235 | 14,175 | 124,579 | 7,317,795 |
| 80 to 84 years | 693 | 8,950 | 98,580 | 5,743,327 |
| 85 years and over | 530 | 8,288 | 98,126 | 5,493,433 |
| MEDIAN AGE BY SEX | ||||
| Both sexes Map | 36.80 | 34.90 | 38.00 | 37.20 |
| Male Map | 34.50 | 32.80 | 36.40 | 35.80 |
| Female Map | 38.70 | 36.80 | 39.30 | 38.50 |
| HOUSEHOLDS | ||||
| Total Households Map | 26,150 | 304,042 | 2,156,411 | 116,716,292 |
| HOUSEHOLDS, HOUSEHOLD TYPE | ||||
| Family households: Map | 16,835 | 203,520 | 1,447,002 | 77,538,296 |
| Husband-wife family Map | 8,450 | 122,000 | 1,026,739 | 56,510,377 |
| Other family: Map | 8,385 | 81,520 | 420,263 | 21,027,919 |
| Male householder, no wife present Map | 1,677 | 19,519 | 104,375 | 5,777,570 |
| Female householder, no husband present Map | 6,708 | 62,001 | 315,888 | 15,250,349 |
| Nonfamily households: Map | 9,315 | 100,522 | 709,409 | 39,177,996 |
| Householder living alone Map | 7,749 | 79,375 | 563,003 | 31,204,909 |
| Householder not living alone Map | 1,566 | 21,147 | 146,406 | 7,973,087 |
| HOUSEHOLDS, HISPANIC OR LATINO ORIGIN OF HOUSEHOLDER | ||||
| Not Hispanic or Latino householder: Map | 24,855 | 275,549 | 2,042,193 | 103,254,926 |
| Hispanic or Latino householder: Map | 1,295 | 28,493 | 114,218 | 13,461,366 |
| HOUSEHOLDS, RACE OF HOUSEHOLDER | ||||
| Householder who is White alone | 2,152 | 63,299 | 1,341,508 | 89,754,352 |
| Householder who is Black or African American alone | 21,778 | 206,229 | 622,144 | 14,129,983 |
| Householder who is American Indian and Alaska Native alone | 92 | 1,242 | 6,756 | 939,707 |
| Householder who is Asian alone | 883 | 10,162 | 99,940 | 4,632,164 |
| Householder who is Native Hawaiian and Other Pacific Islander alone | 17 | 177 | 993 | 143,932 |
| Householder who is Some Other Race alone | 664 | 15,650 | 46,824 | 4,916,427 |
| Householder who is Two or More Races | 564 | 7,283 | 38,246 | 2,199,727 |
| HOUSEHOLDS, HOUSEHOLD TYPE BY HOUSEHOLD SIZE | ||||
| Family households: Map | 16,835 | 203,520 | 1,447,002 | 77,538,296 |
| 2-person household Map | 6,196 | 70,167 | 565,688 | 31,882,616 |
| 3-person household Map | 4,471 | 50,710 | 349,624 | 17,765,829 |
| 4-person household Map | 3,030 | 39,283 | 295,126 | 15,214,075 |
| 5-person household Map | 1,691 | 22,007 | 138,670 | 7,411,997 |
| 6-person household Map | 785 | 10,848 | 56,194 | 3,026,278 |
| 7-or-more-person household Map | 662 | 10,505 | 41,700 | 2,237,501 |
| Nonfamily households: Map | 9,315 | 100,522 | 709,409 | 39,177,996 |
| 1-person household Map | 7,749 | 79,375 | 563,003 | 31,204,909 |
| 2-person household Map | 1,304 | 14,953 | 113,850 | 6,360,012 |
| 3-person household Map | 166 | 2,901 | 19,295 | 992,156 |
| 4-person household Map | 55 | 1,768 | 8,215 | 411,171 |
| 5-person household Map | 24 | 907 | 2,989 | 126,634 |
| 6-person household Map | 9 | 352 | 1,125 | 48,421 |
| 7-or-more-person household Map | 8 | 266 | 932 | 34,693 |
| HOUSING UNITS | ||||
| Total Housing Units Map | 28,567 | 328,182 | 2,378,814 | 131,704,730 |
| HOUSING UNITS, OCCUPANCY STATUS | ||||
| Occupied Map | 26,150 | 304,042 | 2,156,411 | 116,716,292 |
| Vacant Map | 2,417 | 24,140 | 222,403 | 14,988,438 |
| HOUSING UNITS, OCCUPIED, TENURE | ||||
| Owned with a mortgage or a loan Map | 12,174 | 167,187 | 1,146,636 | 52,979,430 |
| Owned free and clear Map | 1,777 | 23,806 | 309,139 | 23,006,644 |
| Renter occupied Map | 12,199 | 113,049 | 700,636 | 40,730,218 |
| HOUSING UNITS, VACANT, VACANCY STATUS | ||||
| For rent Map | 973 | 9,246 | 61,874 | 4,137,567 |
| Rented, not occupied Map | 26 | 405 | 3,742 | 206,825 |
| For sale only Map | 645 | 5,095 | 32,883 | 1,896,796 |
| Sold, not occupied Map | 49 | 656 | 6,586 | 421,032 |
| For seasonal, recreational, or occasional use Map | 208 | 676 | 55,786 | 4,649,298 |
| For migrant workers Map | 0 | 5 | 177 | 24,161 |
| Other vacant Map | 516 | 8,057 | 61,355 | 3,652,759 |
| HOUSING UNITS, OCCUPIED, AVERAGE HOUSEHOLD SIZE BY TENURE | ||||
| Total: Map | 2.59 | 2.78 | 2.61 | 2.58 |
| Owner occupied Map | 2.70 | 2.86 | 2.71 | 2.65 |
| Renter occupied Map | 2.46 | 2.63 | 2.42 | 2.44 |
| HOUSING UNITS, OCCUPIED, TENURE BY RACE OF HOUSEHOLDER | ||||
| Owner occupied: Map | 13,951 | 190,993 | 1,455,775 | 75,986,074 |
| Householder who is White alone Map | 1,654 | 46,428 | 1,020,305 | 63,446,275 |
| Householder who is Black or African American alone Map | 10,956 | 125,636 | 323,160 | 6,261,464 |
| Householder who is American Indian and Alaska Native alone Map | 52 | 705 | 3,783 | 509,588 |
| Householder who is Asian alone Map | 634 | 6,659 | 66,324 | 2,688,861 |
| Householder who is Native Hawaiian and Other Pacific Islander alone Map | 7 | 69 | 458 | 61,911 |
| Householder who is Some Other Race alone Map | 358 | 7,366 | 20,907 | 1,975,817 |
| Householder who is Two or More Races Map | 290 | 4,130 | 20,838 | 1,042,158 |
| Renter occupied: Map | 12,199 | 113,049 | 700,636 | 40,730,218 |
| Householder who is White alone Map | 498 | 16,871 | 321,203 | 26,308,077 |
| Householder who is Black or African American alone Map | 10,822 | 80,593 | 298,984 | 7,868,519 |
| Householder who is American Indian and Alaska Native alone Map | 40 | 537 | 2,973 | 430,119 |
| Householder who is Asian alone Map | 249 | 3,503 | 33,616 | 1,943,303 |
| Householder who is Native Hawaiian and Other Pacific Islander alone Map | 10 | 108 | 535 | 82,021 |
| Householder who is Some Other Race alone Map | 306 | 8,284 | 25,917 | 2,940,610 |
| Householder who is Two or More Races Map | 274 | 3,153 | 17,408 | 1,157,569 |
| HOUSING UNITS, OCCUPIED, TENURE BY HISPANIC OR LATINO ORIGIN OF HOUSEHOLDER | ||||
| Owner occupied: Map | 13,951 | 190,993 | 1,455,775 | 75,986,074 |
| Not Hispanic or Latino householder Map | 13,250 | 176,776 | 1,397,724 | 69,617,625 |
| Hispanic or Latino householder Map | 701 | 14,217 | 58,051 | 6,368,449 |
| Renter occupied: Map | 12,199 | 113,049 | 700,636 | 40,730,218 |
| Not Hispanic or Latino householder Map | 11,605 | 98,773 | 644,469 | 33,637,301 |
| Hispanic or Latino householder Map | 594 | 14,276 | 56,167 | 7,092,917 |
| HOUSING UNITS, OCCUPIED, TENURE BY HOUSEHOLD SIZE | ||||
| Owner occupied: Map | 13,951 | 190,993 | 1,455,775 | 75,986,074 |
| 1-person household Map | 3,459 | 42,987 | 307,832 | 16,453,569 |
| 2-person household Map | 4,364 | 56,837 | 495,651 | 27,618,605 |
| 3-person household Map | 2,569 | 34,822 | 259,318 | 12,517,563 |
| 4-person household Map | 1,750 | 27,007 | 224,773 | 10,998,793 |
| 5-person household Map | 938 | 14,680 | 100,730 | 5,057,765 |
| 6-person household Map | 458 | 7,291 | 39,299 | 1,965,796 |
| 7-or-more-person household Map | 413 | 7,369 | 28,172 | 1,373,983 |
| Renter occupied: Map | 12,199 | 113,049 | 700,636 | 40,730,218 |
| 1-person household Map | 4,290 | 36,388 | 255,171 | 14,751,340 |
| 2-person household Map | 3,136 | 28,283 | 183,887 | 10,624,023 |
| 3-person household Map | 2,068 | 18,789 | 109,601 | 6,240,422 |
| 4-person household Map | 1,335 | 14,044 | 78,568 | 4,626,453 |
| 5-person household Map | 777 | 8,234 | 40,929 | 2,480,866 |
| 6-person household Map | 336 | 3,909 | 18,020 | 1,108,903 |
| 7-or-more-person household Map | 257 | 3,402 | 14,460 | 898,211 |
Loading...